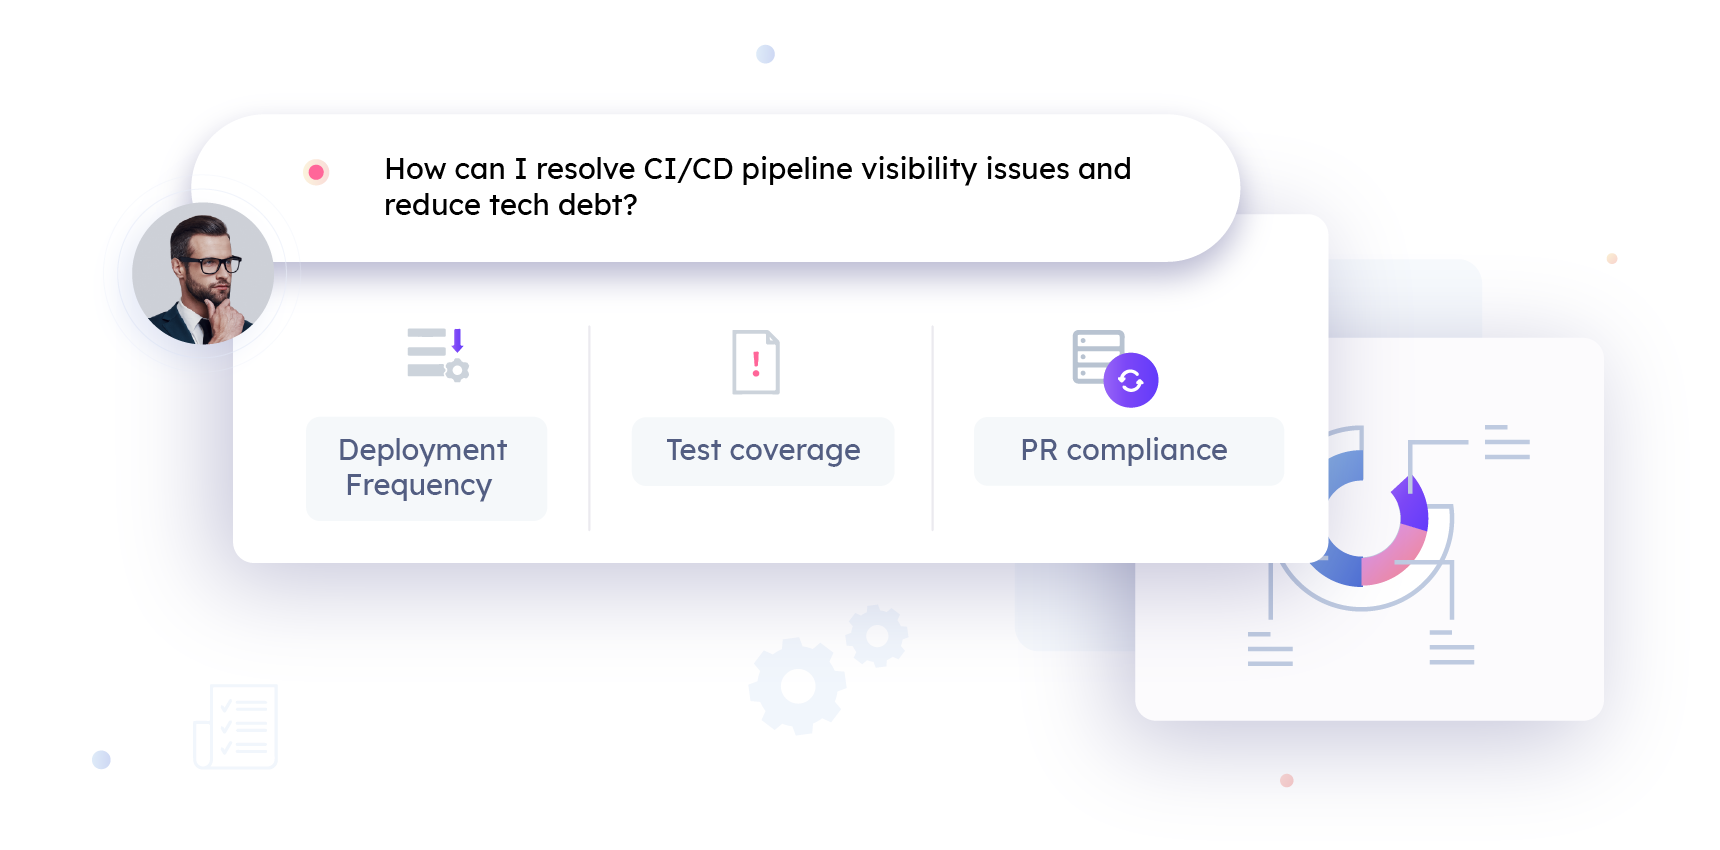
CI/CD Pipeline Monitoring
Unify CI/CD monitoring and governance for timely and high-quality deployments
CI/CD Pipeline Monitoring Challenges
While every DevOps team operates with a different set of tools and processes, they often encounter some common challenges that prevent them from making the most of their CI/CD investments.
-
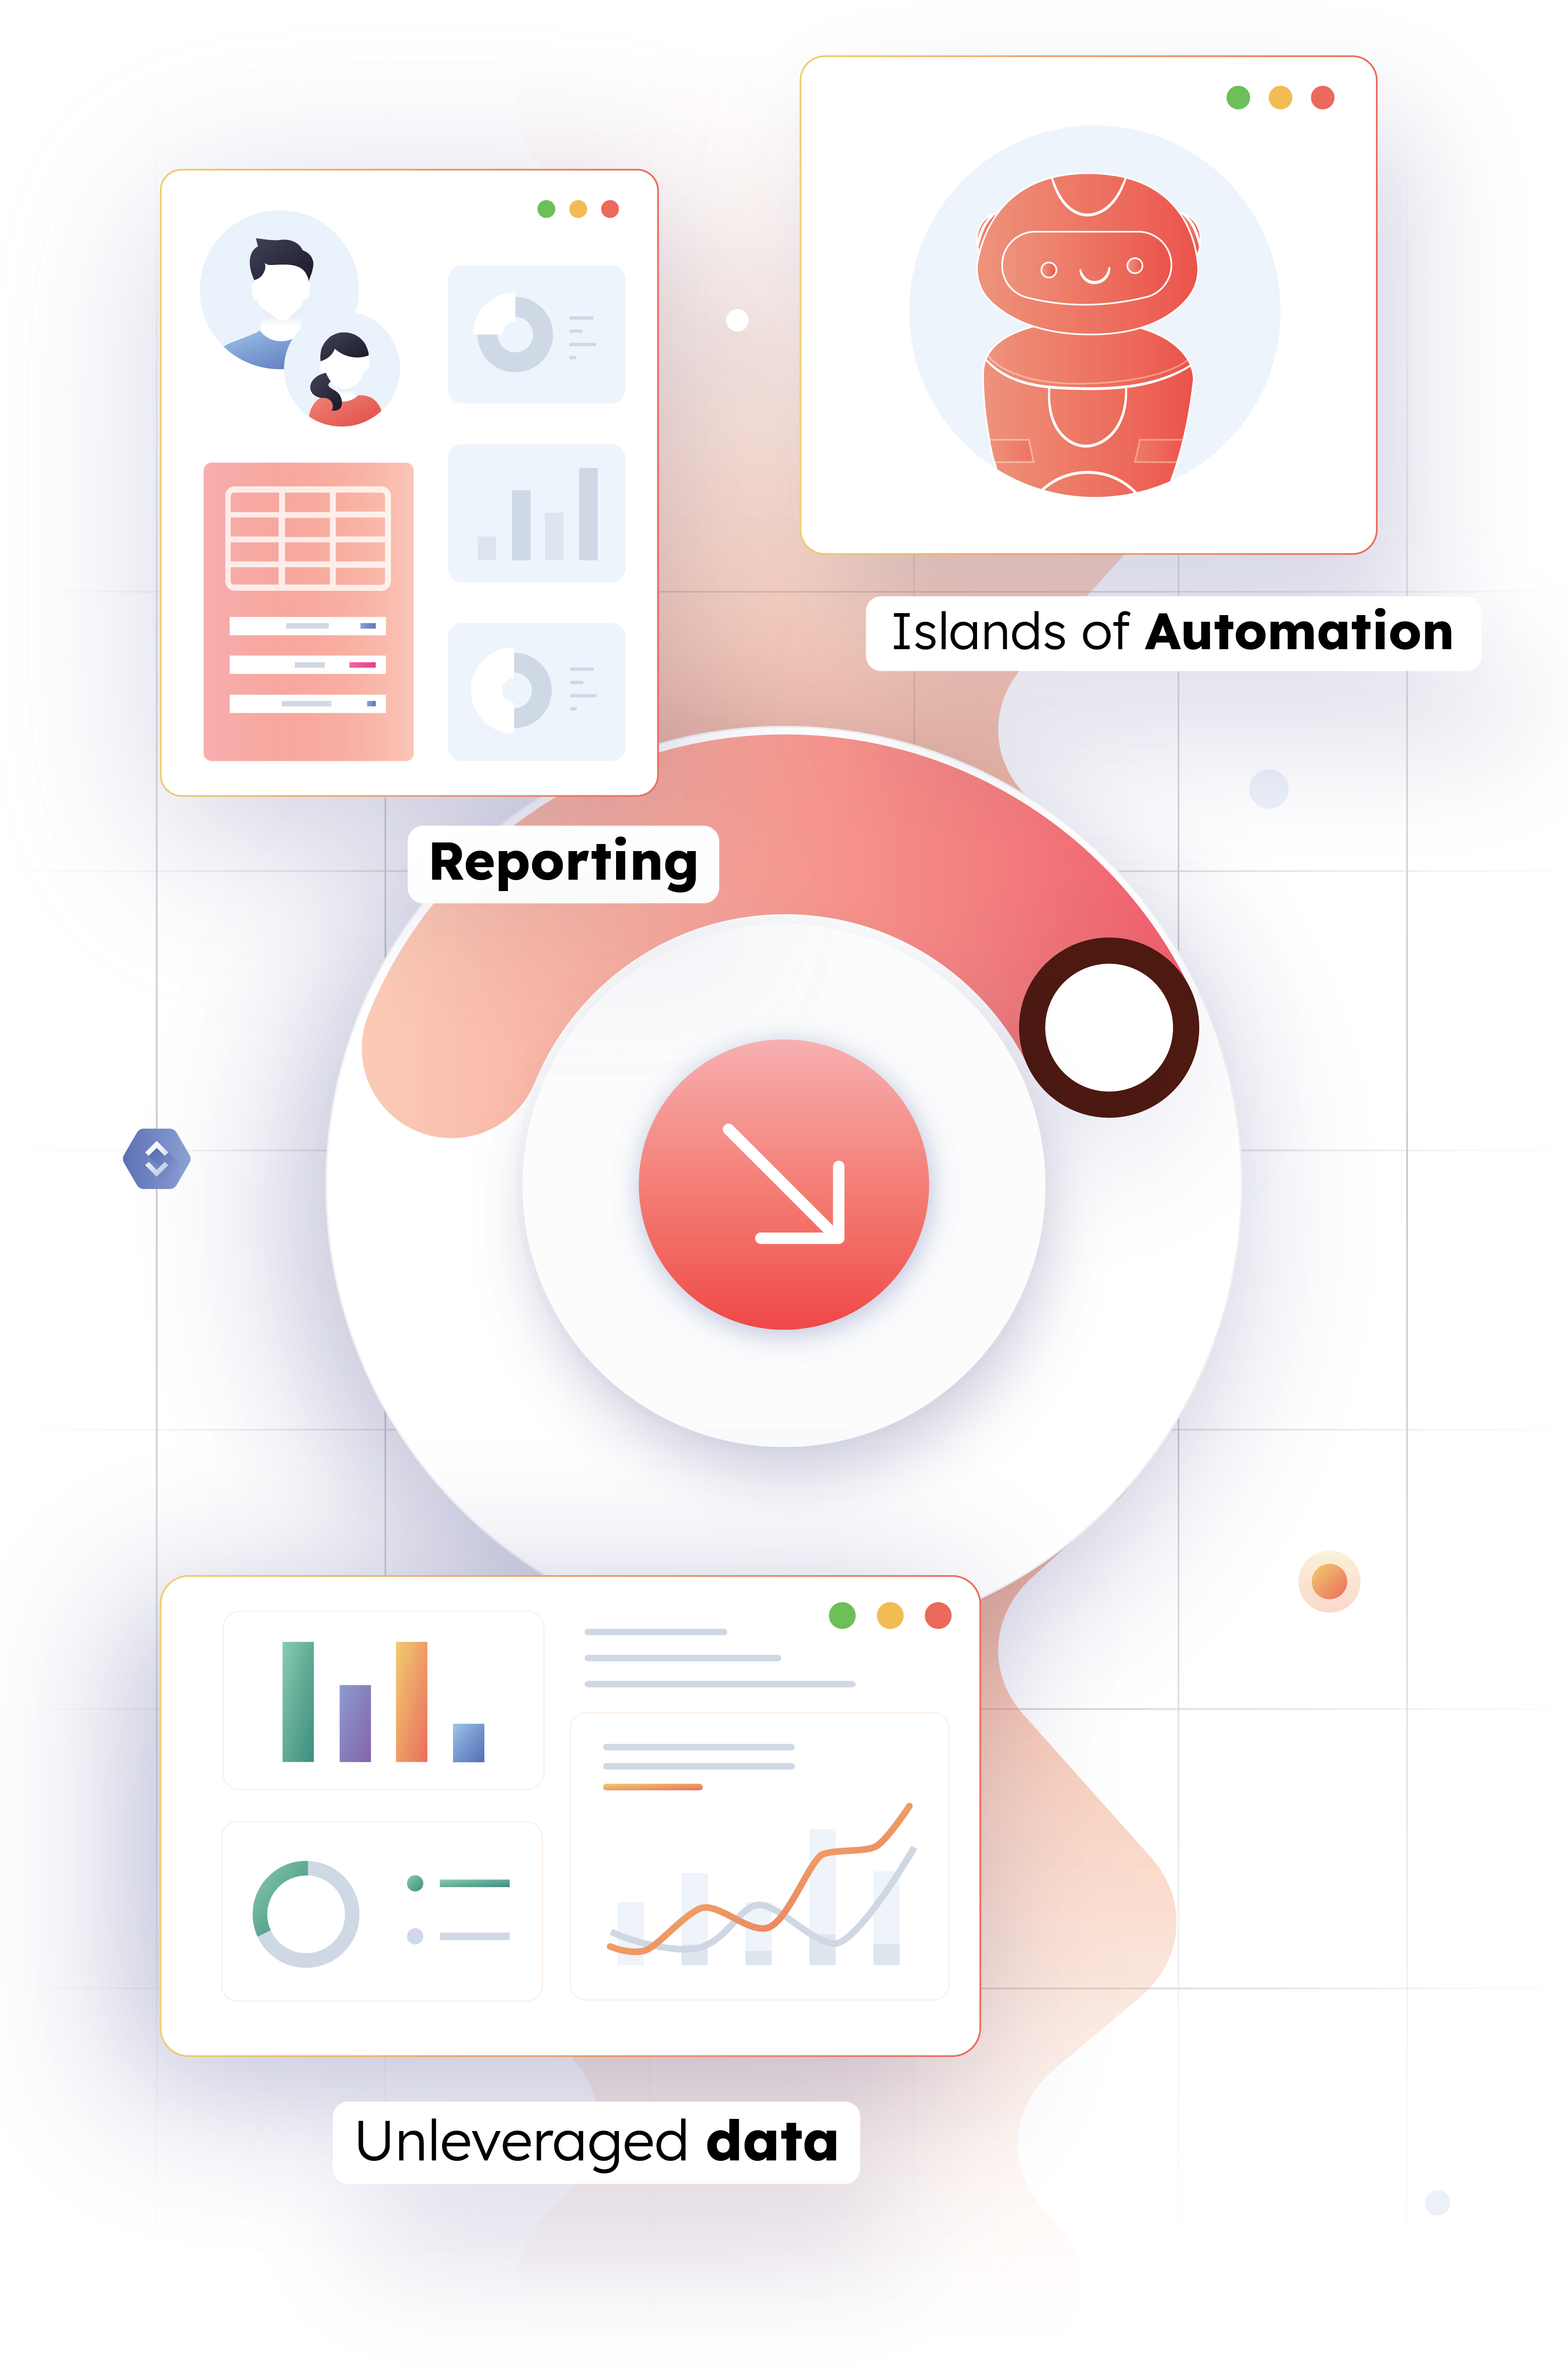
Islands of Automation
Though teams have automated CI/CD pipelines, there are still multiple process gaps requiring manual updates, follow-ups, and back-and-forth emails.
-
Unleveraged Data
There’s a lack of data-driven culture in organizations and teams continue to rely on their experience or heuristics for key operational decisions.
-
Reporting
Teams lack real-time visibility into CI/CD pipelines. Business leaders have to wait for someone to gather data from different tools and compile reports for strategic decision-making.
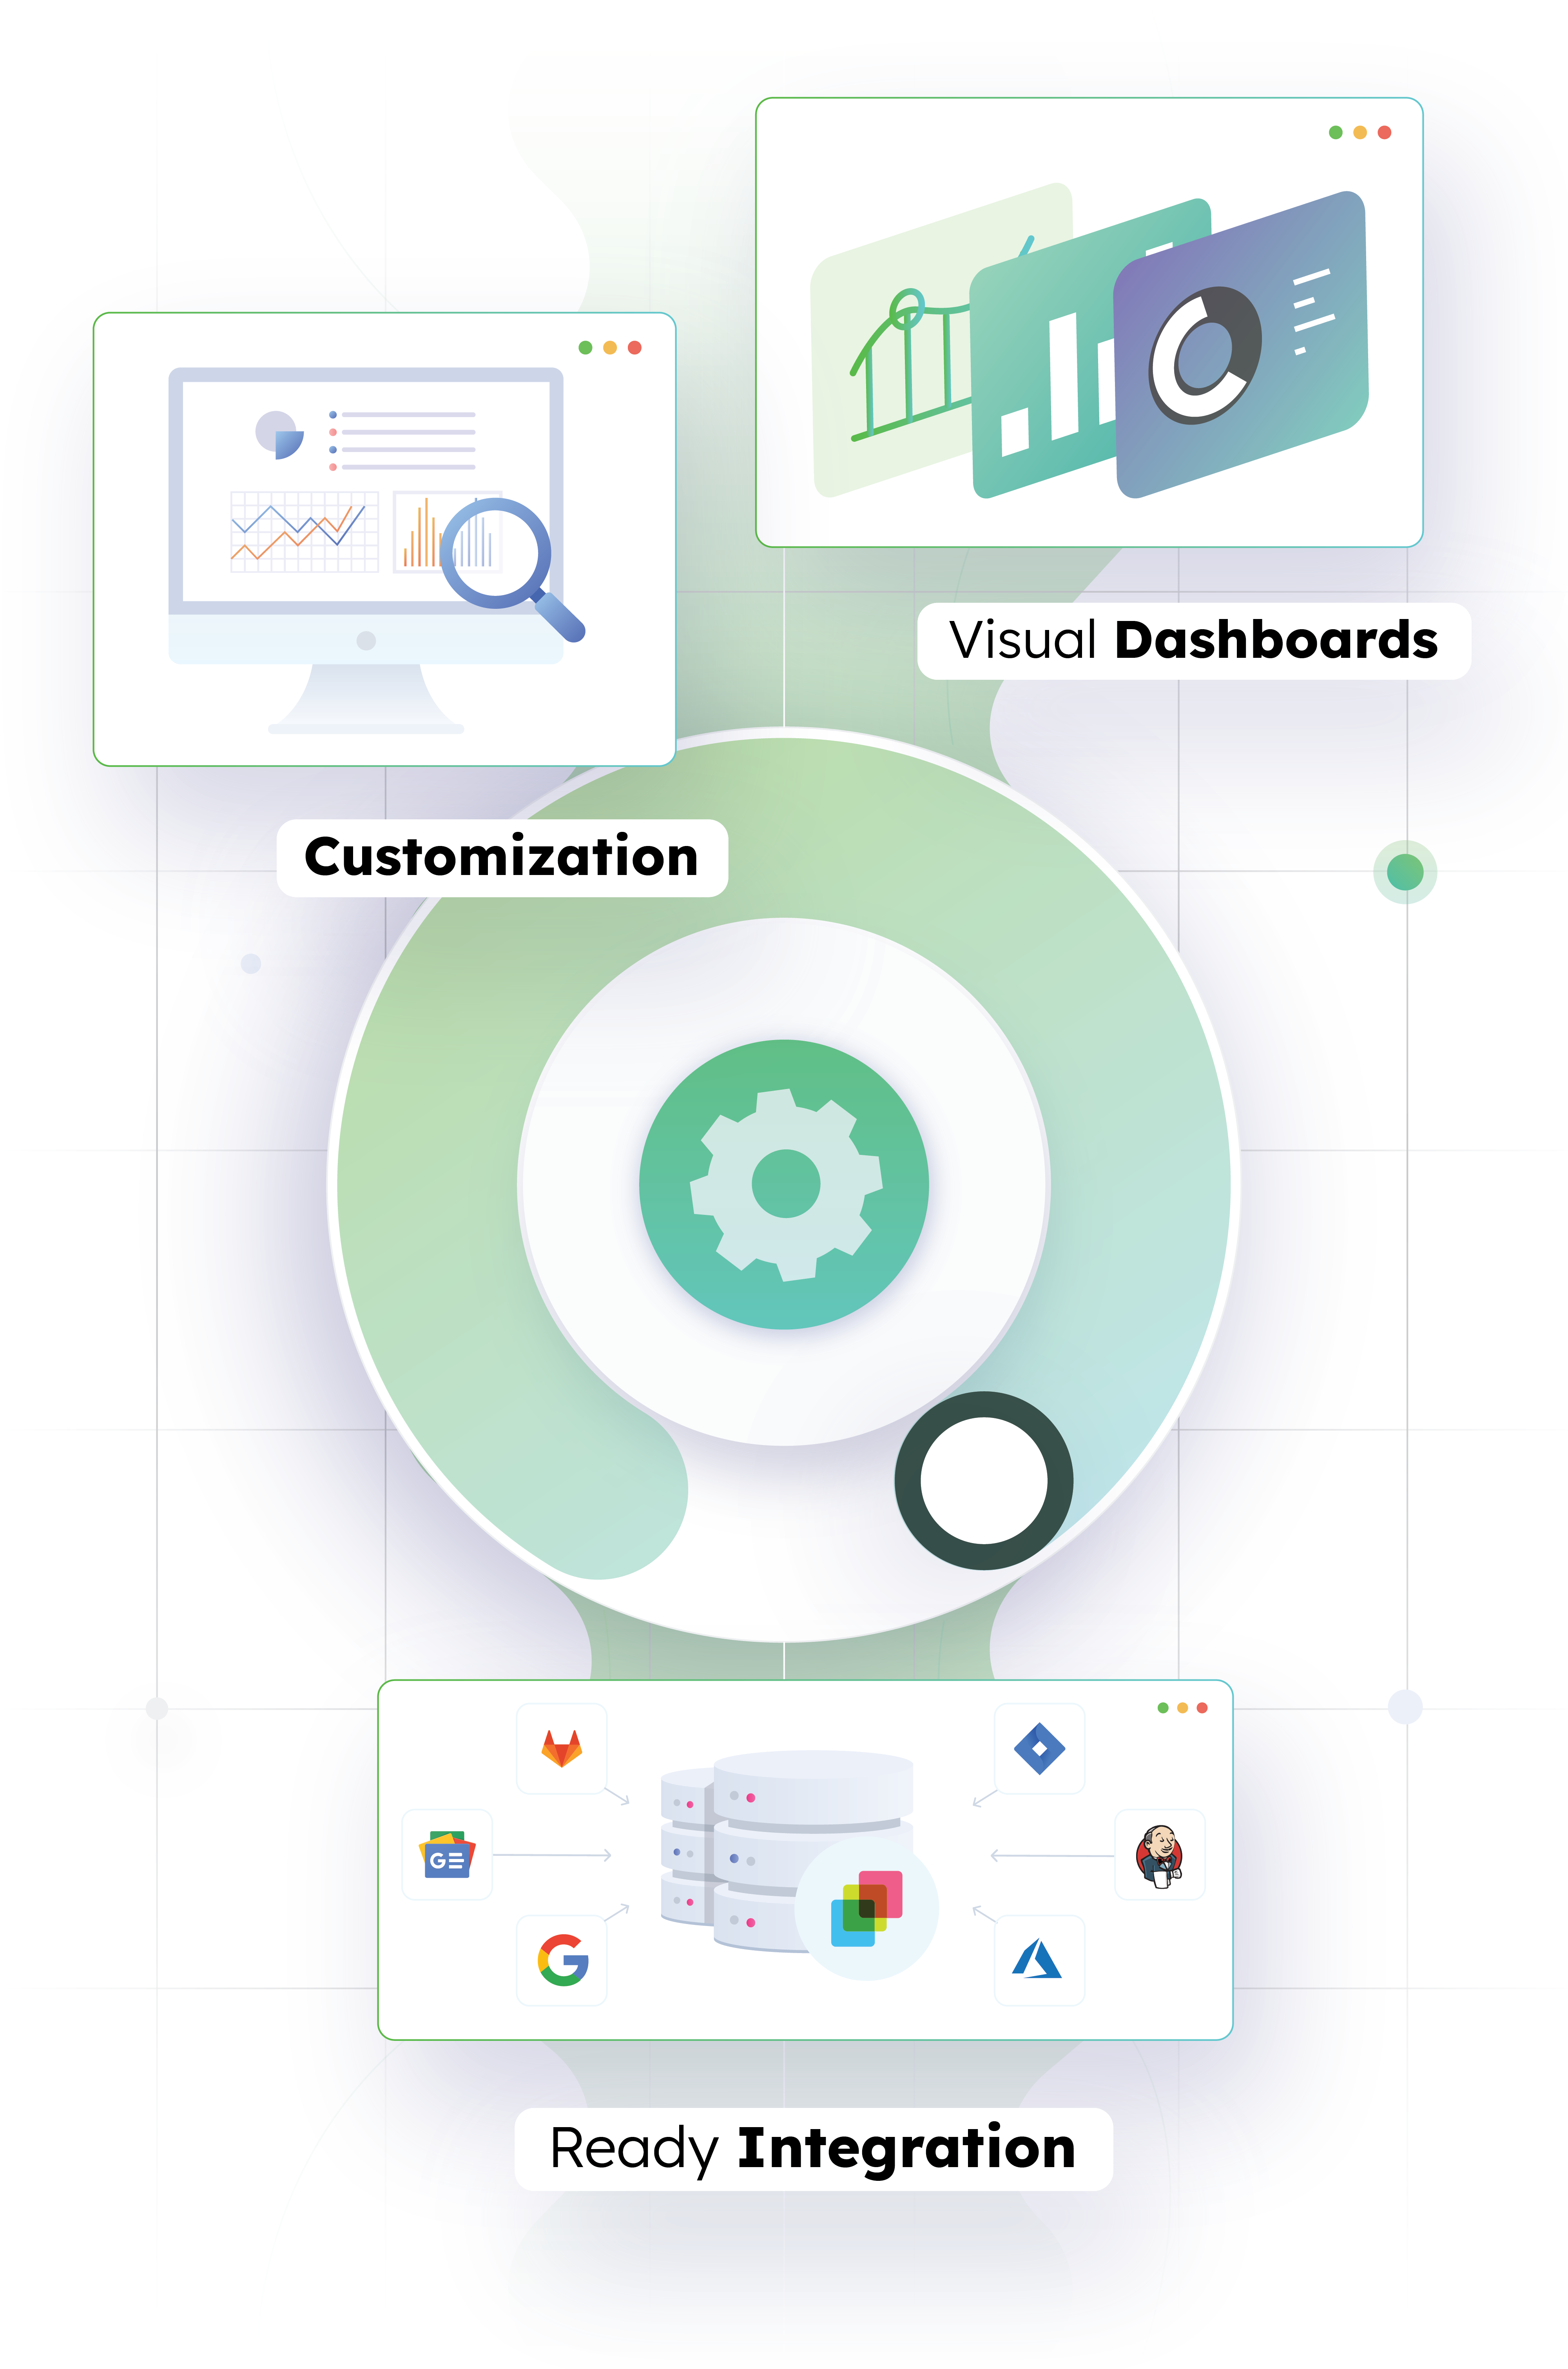
Simplify CI/CD Pipeline Monitoring with Gathr
Solve CI/CD pipeline monitoring challenges while saving time and effort in the configuration and onboarding of tools, visualizing key performance indicators, and more.
-
Ready Integration
Use out-of-the-box connectors to gather data from or write back to tools like Jira, Jenkins, GitHub, and more.
-
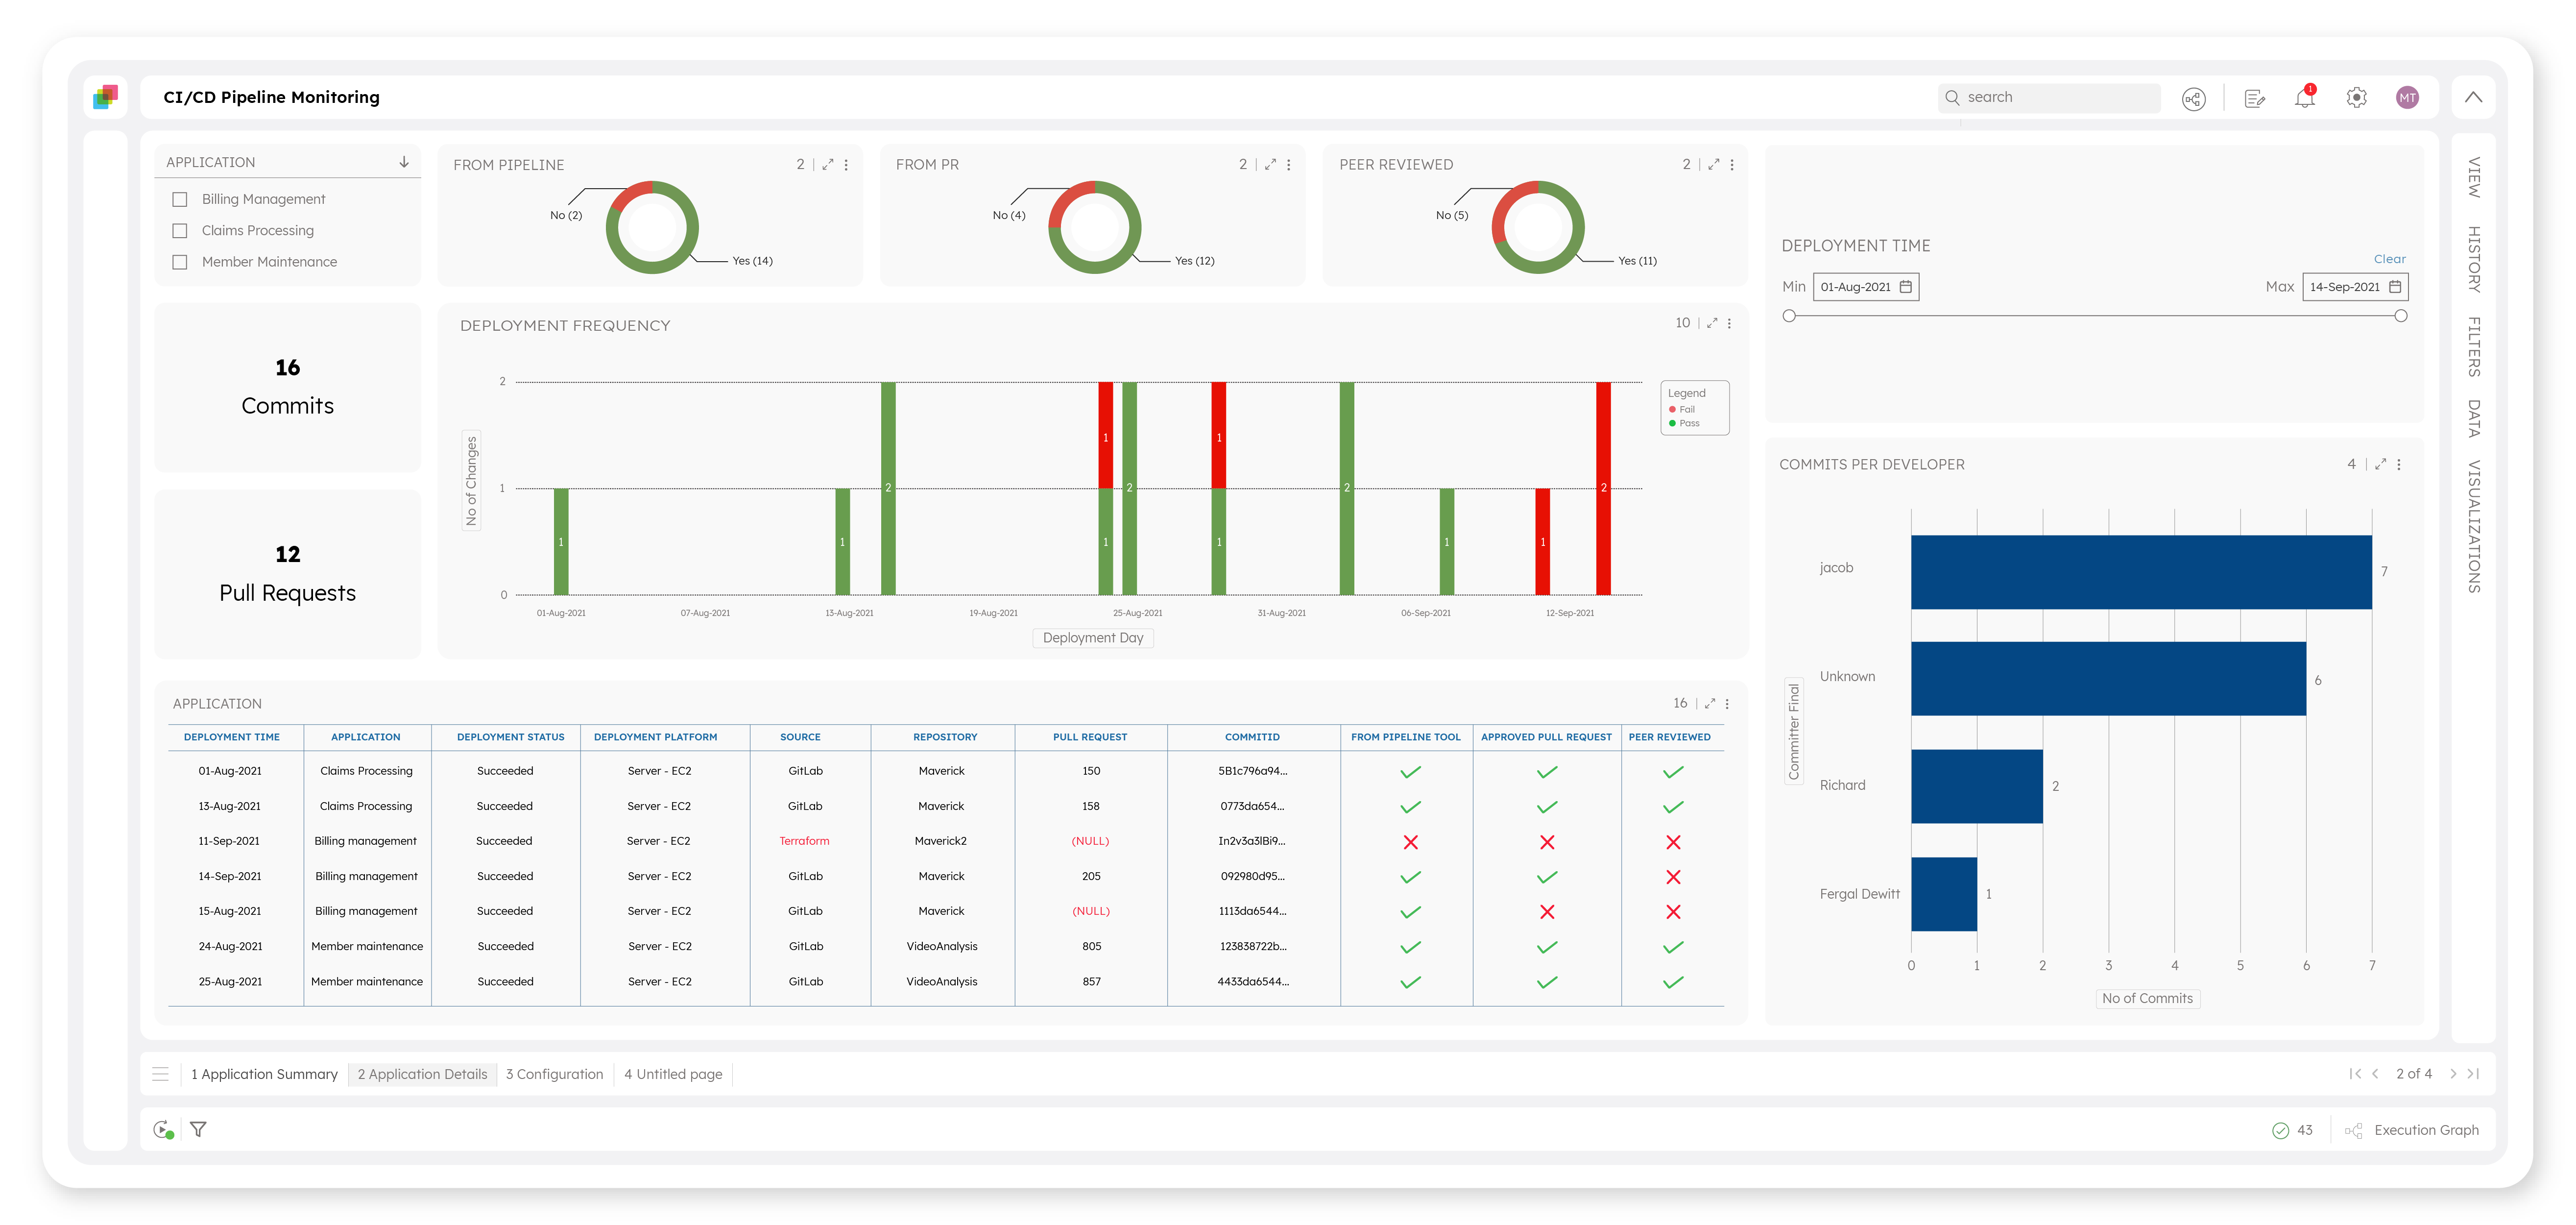
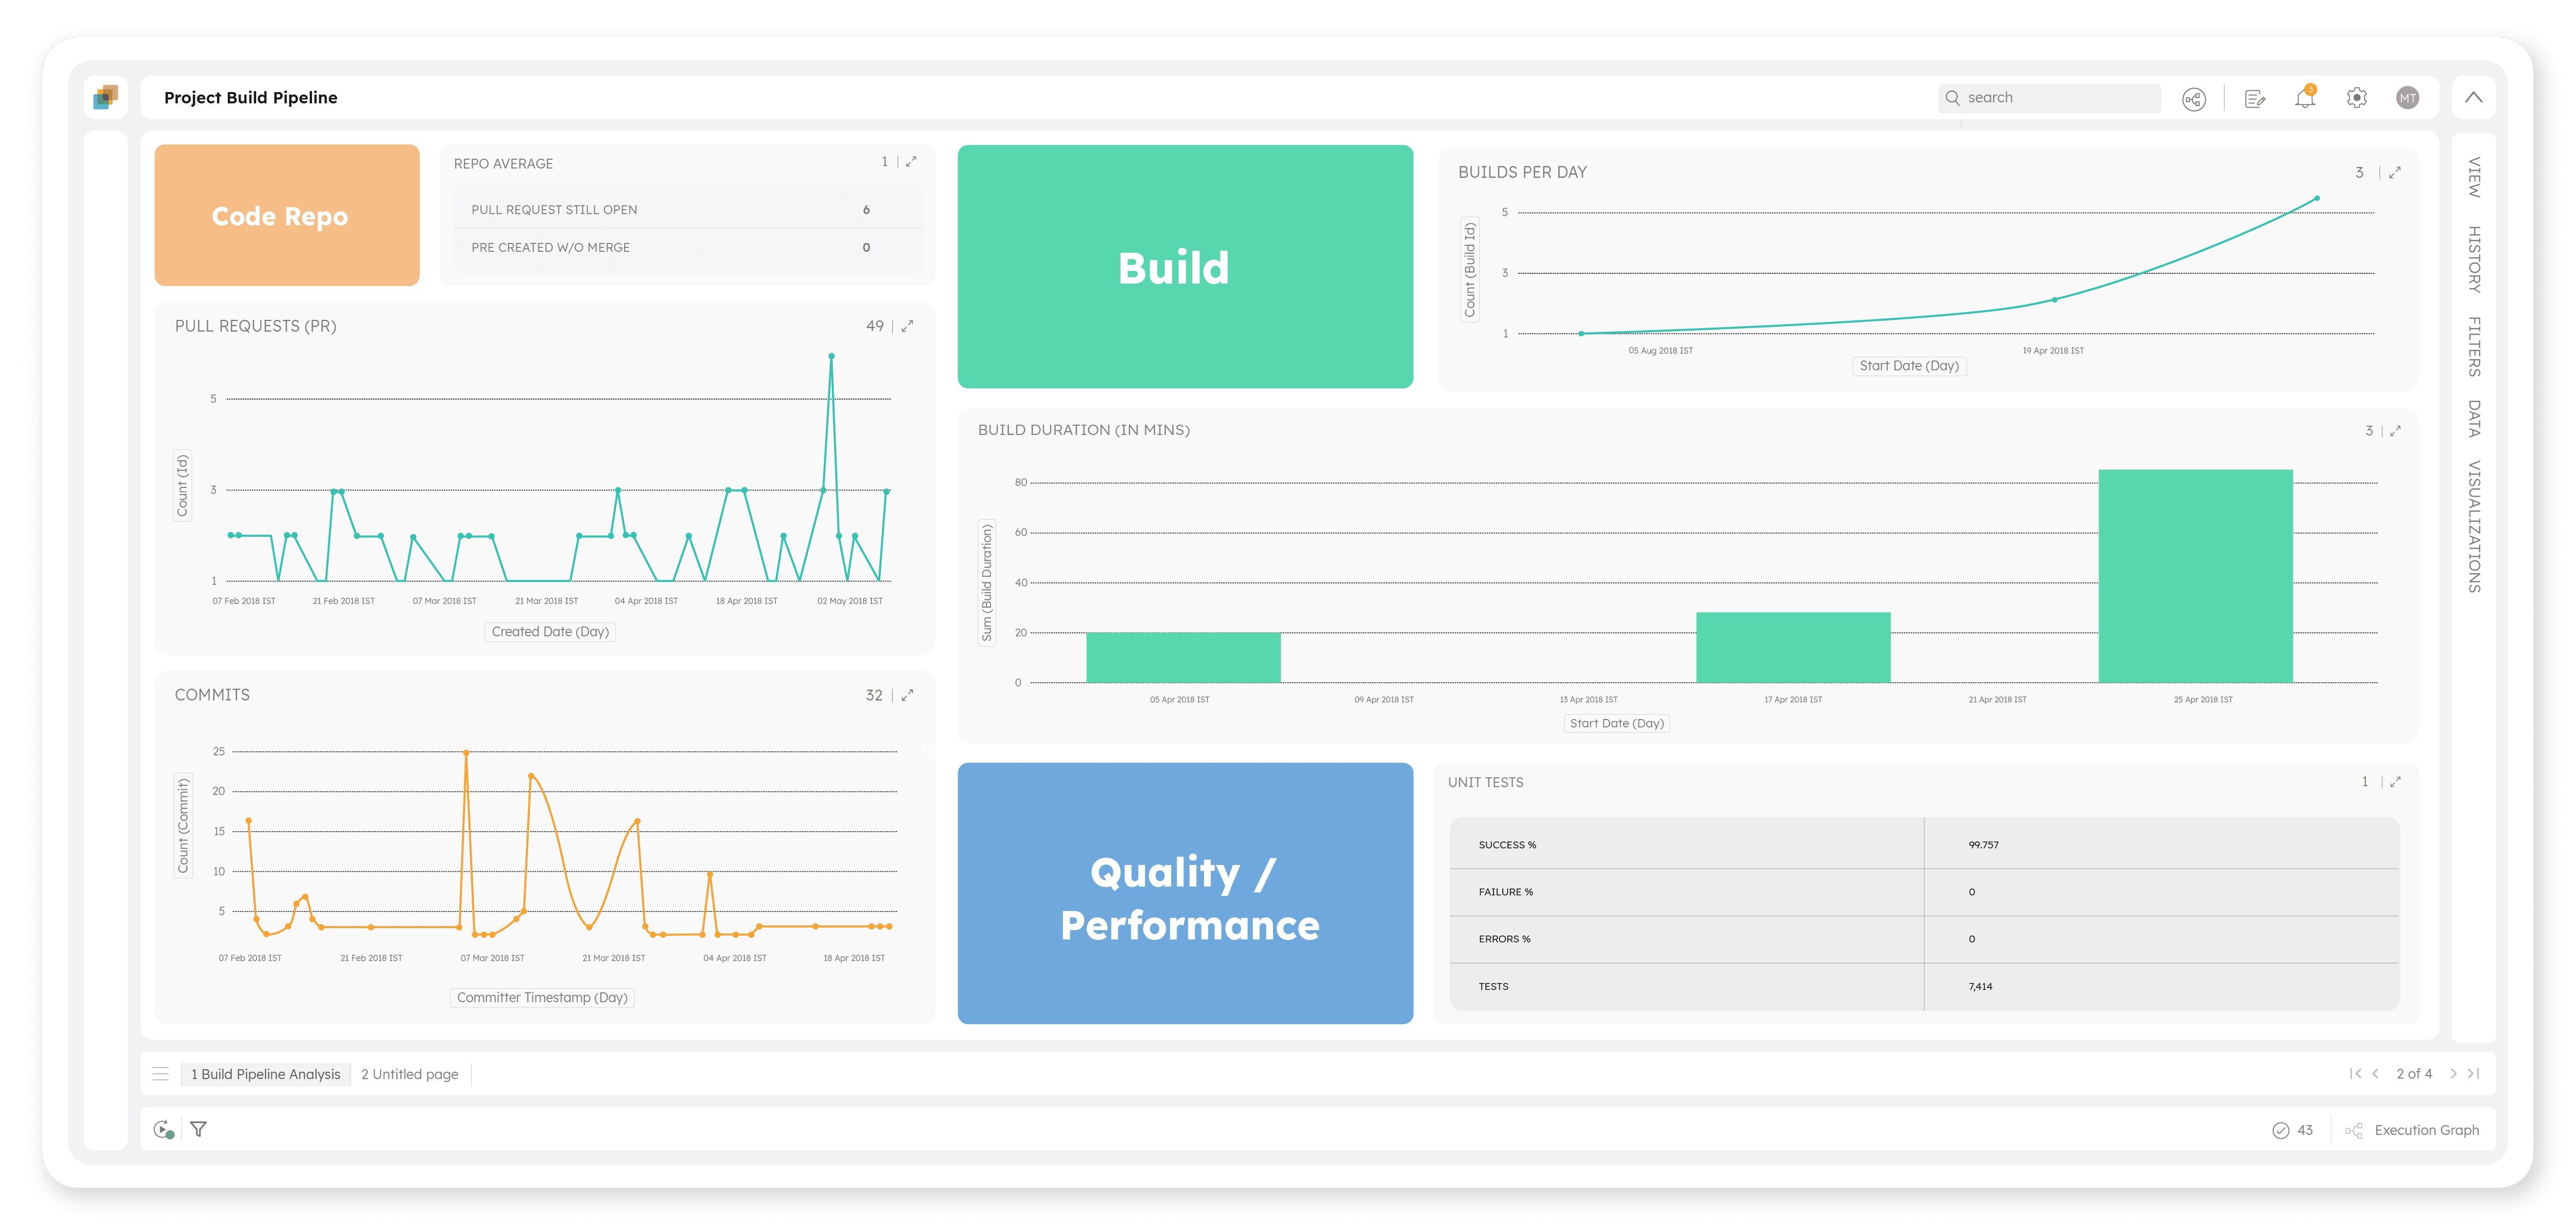
Visual Dashboard
Use a ready-to-use app to track all pull requests, commits, and builds with quality data such as code coverage and technical debt.
-
Customization
Create your own dashboard without writing code to track your CI/CD pipeline. Define your own formulas and alerts to stay on top of your pipeline.
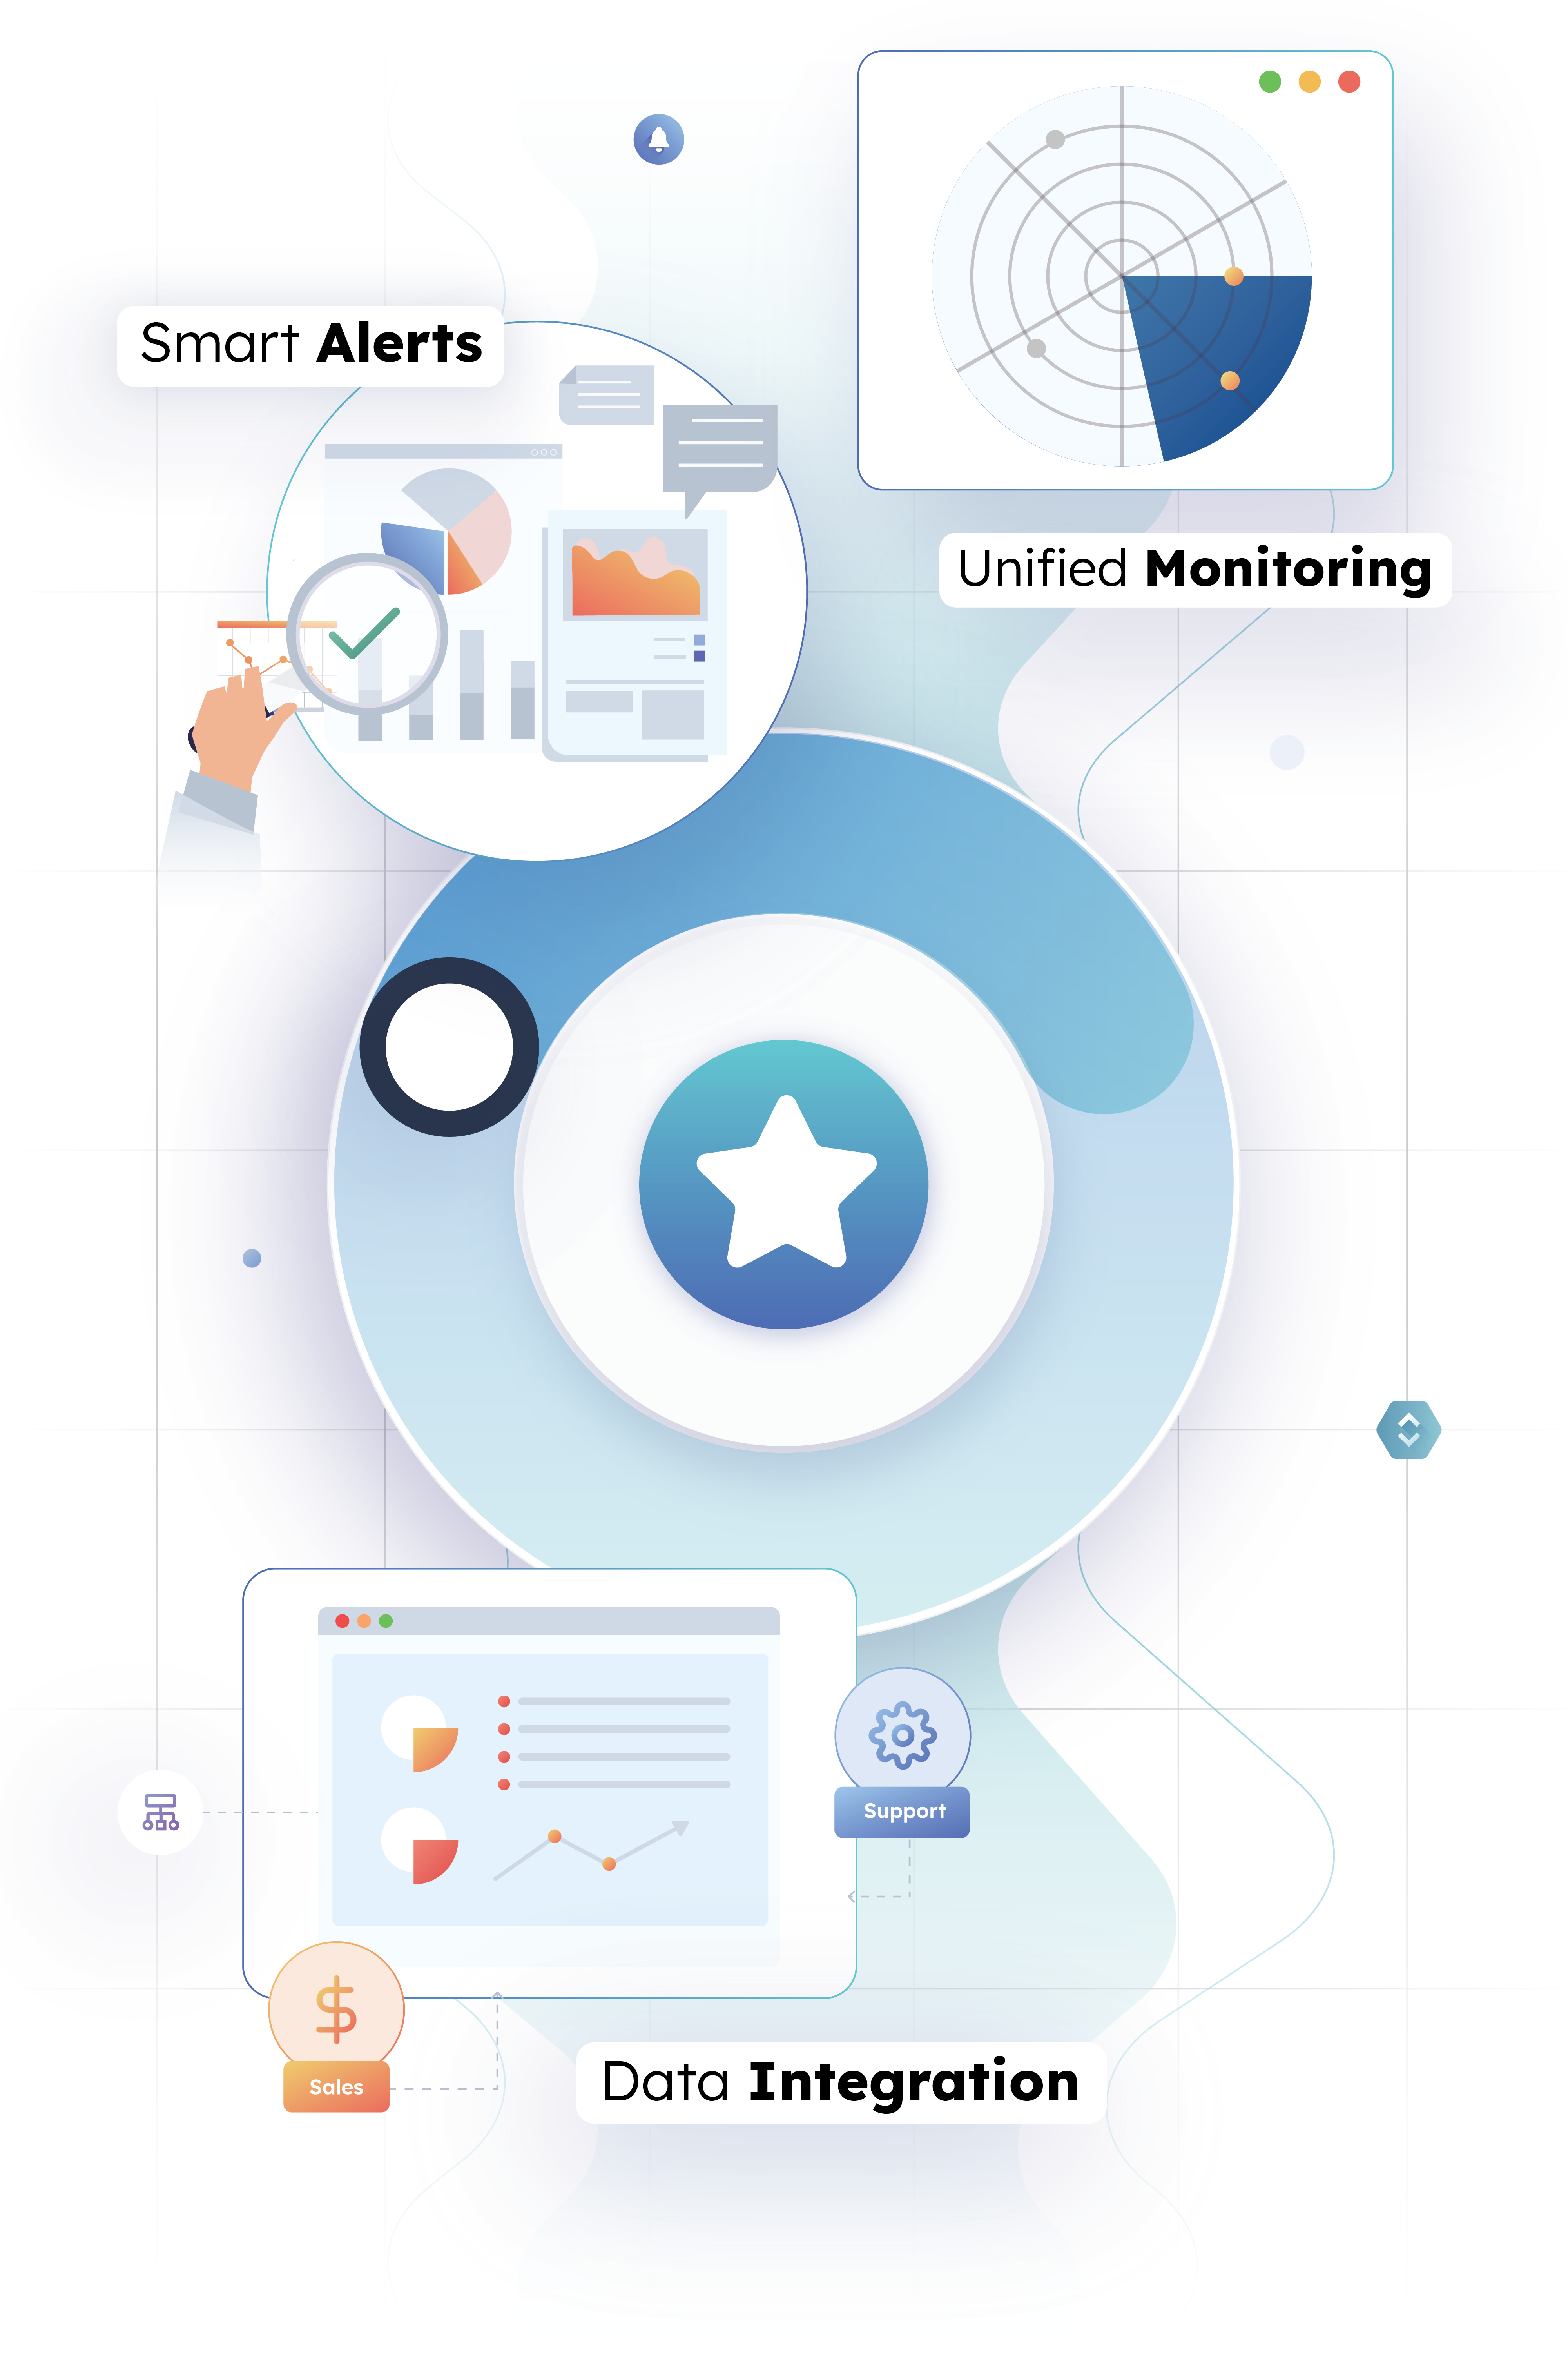
Monitor CI/CD Pipelines, End-to-End
Collect and visualize data and metrics from a wide range of DevOps tools for proactive monitoring of the CI/CD pipeline.
-
Smart Alerts
Monitor the health of the CI/CD build pipeline and set up cognitive, proactive alerts spanning various tools.
-
Data Integration
Assess performance and quality of deployments in a unified way across multiple tools.
-
Unified Monitoring
Extend build pipeline monitoring to include application monitoring (Nagios) and container monitoring (Kubernetes)
Solution Highlights
-
Ready-to-use solution requiring minimal configuration
-
Out-of-the-box connectors to gather and analyze data from multiple tools
-
Ready dashboards and templates to visualize data
-
Python and Machine Learning support for predictive analysis
-
Highly flexible; change formulas and add new tools without coding
Solution Benefits
With easy visibility into the CI/CD pipeline, your teams can collaborate better and avoid common conflicts and issues.
Delivering Great Customer Experiences Consistently
In minutes, we are now able to establish the golden thread – from recurring defects to its source.
Telecom
Head • Solutions Engineering | Telecom Infrastructure
Explore Other Solutions
Gathr offers a host of ready-to-use apps and solutions to address your workflow, process automation, and analytics needs.
DevOps 360
Get a Holistic View of DevOps Unifying Both Application & Infrastructure Data
View Details
DORA Metrics
Track the Effectiveness of your Development and Delivery Processes Across DORA Metrics
View Details
DevOps Traceability
Troubleshoot Defects and Vulnerabilities Faster with End-to-End Traceability
View Details