CUSTOMER STORY
The Challenge
As COVID-19 shutdowns and travel restrictions disrupted business as usual, ensuring business continuity with the highest level of quality became the topmost priority for the executive leadership team at 8×8. Given that the entire workforce was all remote, the only option was to drive it entirely through data since hallway conversations, status meetings with technical project and program managers, and standard reporting metrics were not an option. The focus of the 8×8 team shifted from weekly automated dashboard reports with status updates to executives, to enabling real-time, contextual and integrated visibility across all levels and geographies. 8×8 needed their global data streams to facilitate strategic and operational decision-making akin to the diagnostics monitor in an ICU. The quality and reliability engineering team at HQ were tasked to ensure that productivity and quality were maintained to the highest possible levels to drive customer satisfaction.
The Outcome
Gathr enabled the quality and reliability engineering team at 8×8 HQ to become the de facto data-driven global command center where data from any 8×8 geography and any source tool could be analyzed, and decisions could be directly driven. The mission was to convert the challenge of enabling an all-remote workforce into an opportunity to transform into a completely data-driven quality engineering department. Gathr helped the organization leverage data from its various development and testing tools for continuous monitoring and real-time analytics. It enabled data-driven decision-making for engineers, managers, and CXOs alike, providing full flexibility to integrate new data sources, spin dashboards, tweak measurements for Go/No-go scenarios, define new composite indices, set alerts and triggers, and more. As a result, everyone in the organization is now able to access data (in their context), analyze it, and draw conclusions without waiting for someone in a different time zone to submit a report or attend a call at 3 am.
Here’s the Full Story
For the uninitiated, 8×8 is a 9-times Gartner Magic Quadrant leader in the Unified Communications as a Service (UCaaS) space. The company is known for its eXperience Communications Platform, which brings customers and employees together with an integrated contact center, voice, video, chat, and APIs. 8×8 has more than 58,000 business customers across the globe with two million-plus paid business users. It is obvious that with such numbers the stakes are very high; the company must ensure 99.99% uptime as part of its SLAs. With development going on across multiple product lines, ensuring that bugs aren’t released into production, or worse leading to downtime, is a herculean task on any given day.
The Inflection Point
When the U.S. announced its first ban on travel from China in Jan 2020, very few had predicted that the situation would escalate to such severe proportions in the coming days. However, just six weeks later, the U.S. announced similar restrictions on travel from Europe.
This was an alarming sign for the company, as it had a major development center located out of the U.S. The company had to get back to the drawing board to assess its preparedness for the pandemic. A major point of discussion for the Quality Engineering (QE) department was how to ensure visibility and control with remote development. Until now, the executives had regular face-to-face meetings with managers, with some of them traveling back and forth between the development center and the U.S. headquarters, as and when required. All this was going to be impacted and the company had to quickly find ways to ensure business continuity with an all-remote workforce.
While its web and mobile solutions could facilitate communications and meetings, it had to ensure quick, “always-on” access to all kinds of data to assess quality, health, progress, performance, and productivity parameters.
This was easier said than done as their existing setup wasn’t equipped to readily gather data from different tools and data sources. Further, even if the company could gather all such data, it had to find ways to synthesize it and draw actionable insights; so far, executives had the luxury to wait for someone to deliver the report. With COVID-19 bringing in too many uncertainties, it became imperative not just for the C-suite but also for stakeholders across levels to have near real-time visibility and control over their environment with access to self-service analytics.
Adapting to The New Normal
As discussed above, 8×8 needed to boost its QE capabilities with a solution that could:
- Simplify synthesis of data
- Help identify signals from noise
- Offer unified self-service analytics
This is when the company turned towards Gathr for answers.
Gathr offered the required flexibility and agility to 8×8 to equip its all-remote team with access to the right data at the right time, using out-of-the-box connectors for tools such as Jira, TestRail, Reportportal, SonarQube, GitHub, and more. With these bi-directional connectors, it is possible to connect with tools across the CI/CD Pipeline to not only collect data, but also write back to the tools if required.
It is important to note here that Gathr offers a powerful platform to solve both routine and complex business challenges by unifying data. However, it’s up to business users to make the most of the platform by harnessing data in the right context at the right time.
As Bud and his team were fully aware of which direction to look into to seek answers, he could use the right data to monitor:
- Defect Inflow Insight History & Prediction
- Automation Velocity & Efficiency
- Release Readiness Assessment
- Process Hygiene Insights
- Quality KPIs, and more
These apps allow 8×8 to:
- Visualize and easily slice and dice the data; for example, it is possible to inspect issues by their date of creation, by author, by project, and so on.
- Assess progress by monitoring the total number of issues, their breakdown as bugs vs. stories, and their distribution across different stages (grooming, development, testing, etc.).
- Assess release readiness by monitoring the initial number of planned work items and how they are impacted by the discovery of new bugs and features.
- Monitor the rate of automation across projects and get insights into the ROI of automation by tracking if the automated test suites are able to surface enough defects.
- Perform root cause analysis of issues with quick answers to questions such as who is finding the most bugs, which types of bugs are most frequent, which test suites were created but weren’t executed for a long time, which issues were reponed frequently, had maximum comments, and more
XOPS APPS BY GATHR
DevOps Apps
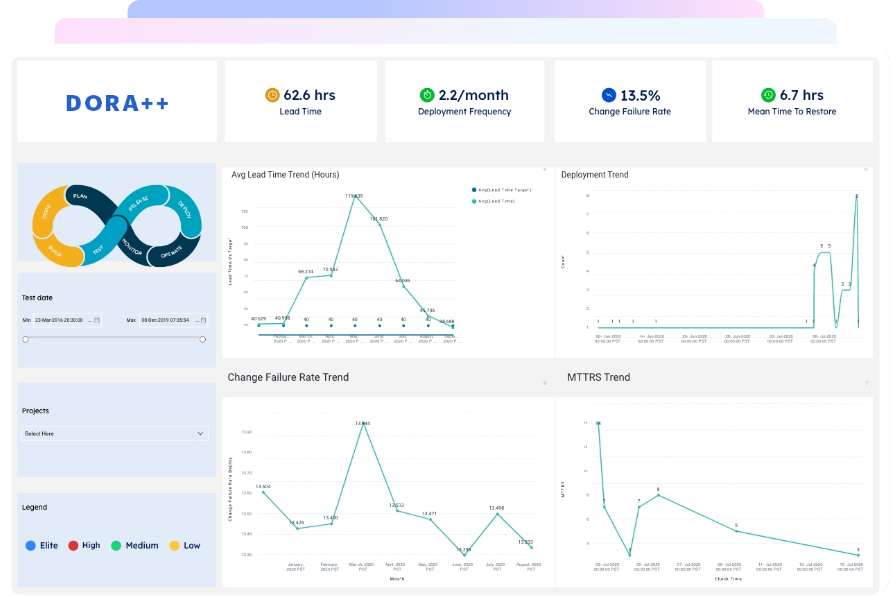
DORA++, DevOps360, & more
Boost your DevOps health and performance by simplifying application planning, development, delivery, and operations stages.
-
DORA++
-
DEVOPS 360
-
VULNERABILITY ANALYSIS
-
CONTINUOUS COMPLIANCE
-
DEVOPS TRACEABILITY
-
CI/CD PIPELINE MONITORING
-
CODE LEAK ANALYSIS
Recent Posts
View more postsBlog
How to overcome the Build vs. Buy dilemma for CI/CD...
Blog
Top 5 DevSecOps trends in 2022
Blog
SPACE metrics – Why they matter & how to get started
Blog
Slow and steady don’t win races – Neither Formula 1...